Gold vs Inflation: Why Gold Does Not Need to Pay Interest
-
As FIAT currencies (Euro, US Dollar, etc…) are printed in large volumes the value of each dollar falls year after year.
This loss of value is referred to as inflation. According to the US government the US dollar has, for example, lost 87% of its value since 1971.
-
If the interest, you earn on your depreciating dollars is less than inflation you will be poorer.
The more dollars chase real goods the faster the value of each dollar falls. Inflation also occurs when more people spend their dollars to buy real goods.
-
Physical gold and silver reliably appreciate over time because they cannot be created out of thin air, while dollars are.
Since Jan 2000 the amount of US dollars (M1 money supply) for example increased from 1,122 billion to 20,585 billion today, causing more dollars to potentially chase precious metals.*
*M1 money supply: - as reported by the Federal Reserve Bank of St. Louis – using the month of January for their respective years. See https://fred.stlouisfed.org/series/M1SL
GOLD vs. SINGAPORE BANK SAVINGS DEPOSITS
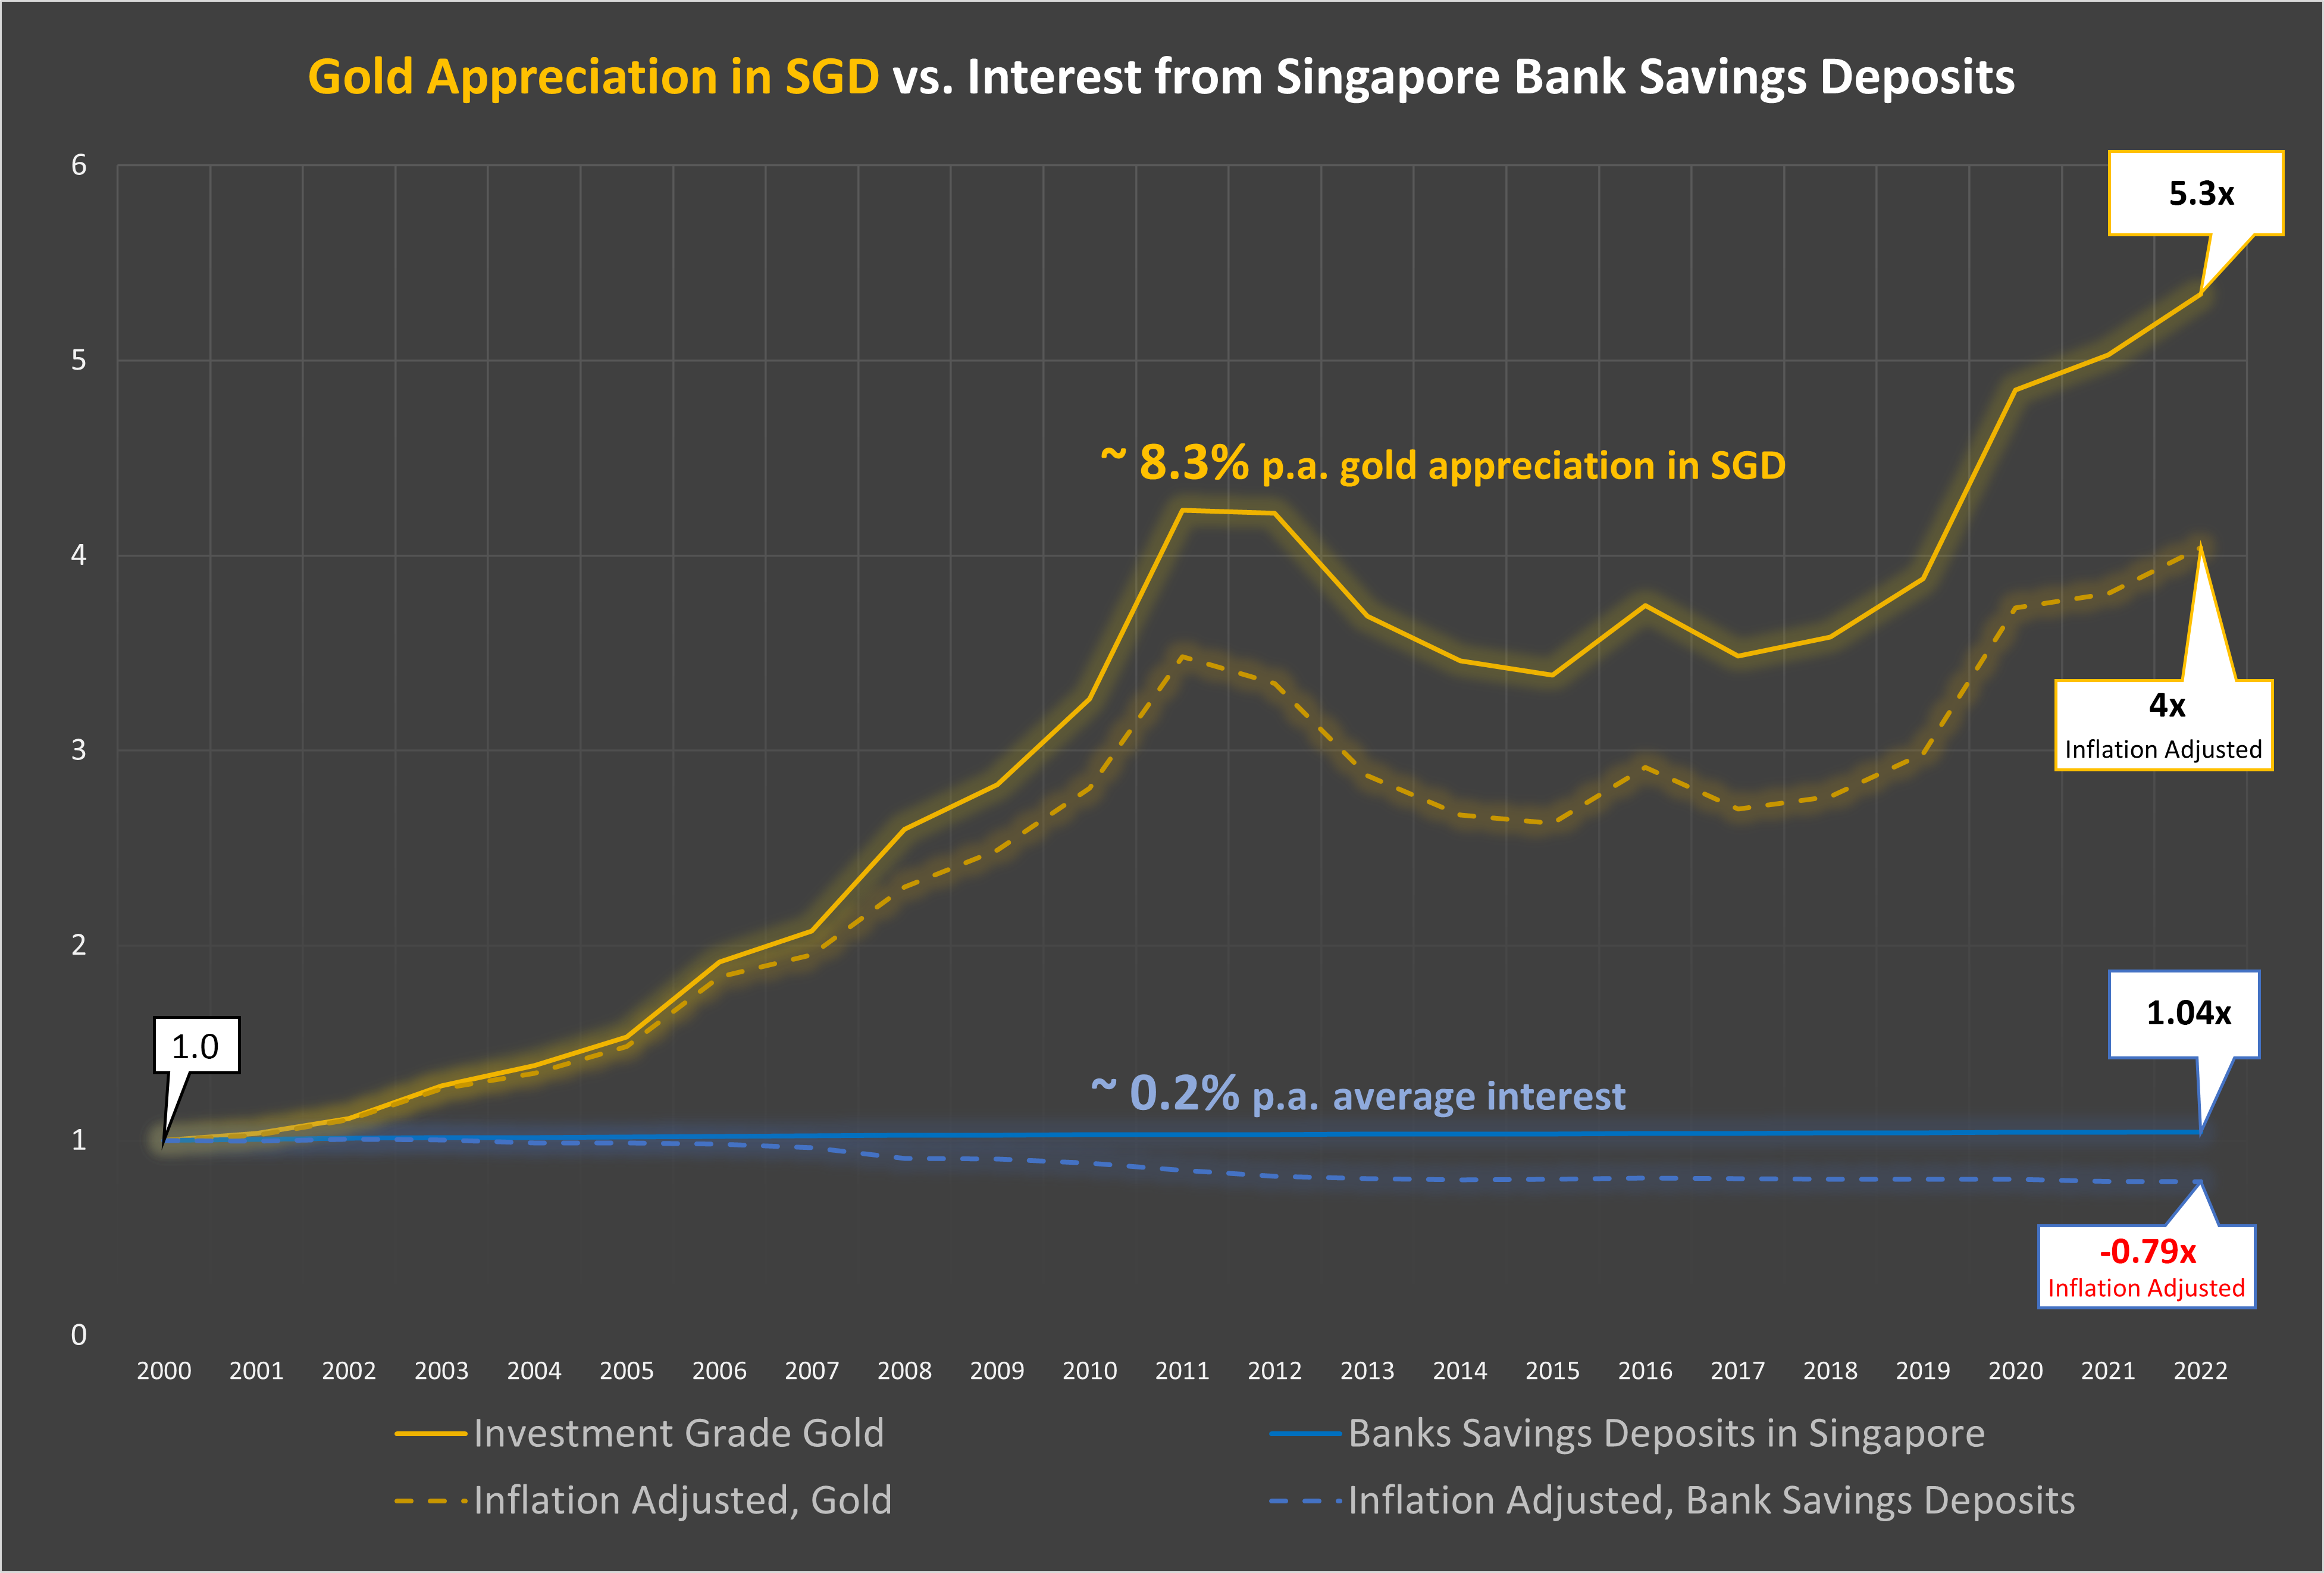
Singapore Bank Savings Deposit have paid an average of ~0.2% annually while Singapore inflation has averaged ~1.3% during this period, resulting in a yearly loss in purchasing power for depositors.
Each dollar deposited in a Bank Savings Deposit would have generated only 4 cents of interest over 22 years while prices of goods have increased by 32% in the same period. Therefore the 1.04 SGD 2022 balance would now only buy 0.79 cents (1.04/ 1.32 = ~0.79) of 2000 dollars. You would have lost 21% of your wealth despite the interest.
Investment Grade Gold, as measured in Singapore dollars, had an average yearly return of ~8.3% since 2000, easily beating the ~1.3% yearly inflation during this period and resulting in strong purchasing power gains.
Each dollar invested in gold in 2000 would have been worth around 5.34 SGD in mid-2022, providing a 404% real purchasing power increase compared to 2000 (5.34/1.32 = 4.04).
Gold rises and falls in the short term, but gold reliably appreciates over time whereas inflation incessantly erodes the value of dollars and interest earned often does not compensate for the loss.
Chart Source Data (click here)
Gold Price: Uses the average yearly gold closing price as reported by Macrotrends.
See https://www.macrotrends.net/1333/historical-gold-prices-100-year-chart
Singapore Bank Savings Deposit Rate: Uses the yearly “Banks Savings Deposit” rate as reported by the Monetary Authority of Singapore (MAS).
See https://eservices.mas.gov.sg/Statistics/msb/InterestRatesOfBanksAndFinanceCompanies.aspx
Singapore Dollar to US Dollar FX Rate: Uses the yearly “US Dollar” rate as reported by the Monetary Authority of Singapore (MAS).
See https://eservices.mas.gov.sg/Statistics/msb/ExchangeRates.aspx
Singapore Inflation Rate: Uses the yearly inflation rate as reported by WorldData.info.
See https://www.worlddata.info/asia/singapore/inflation-rates.php
GOLD vs. UNITED STATES 1 YEAR TREASURY BILLS
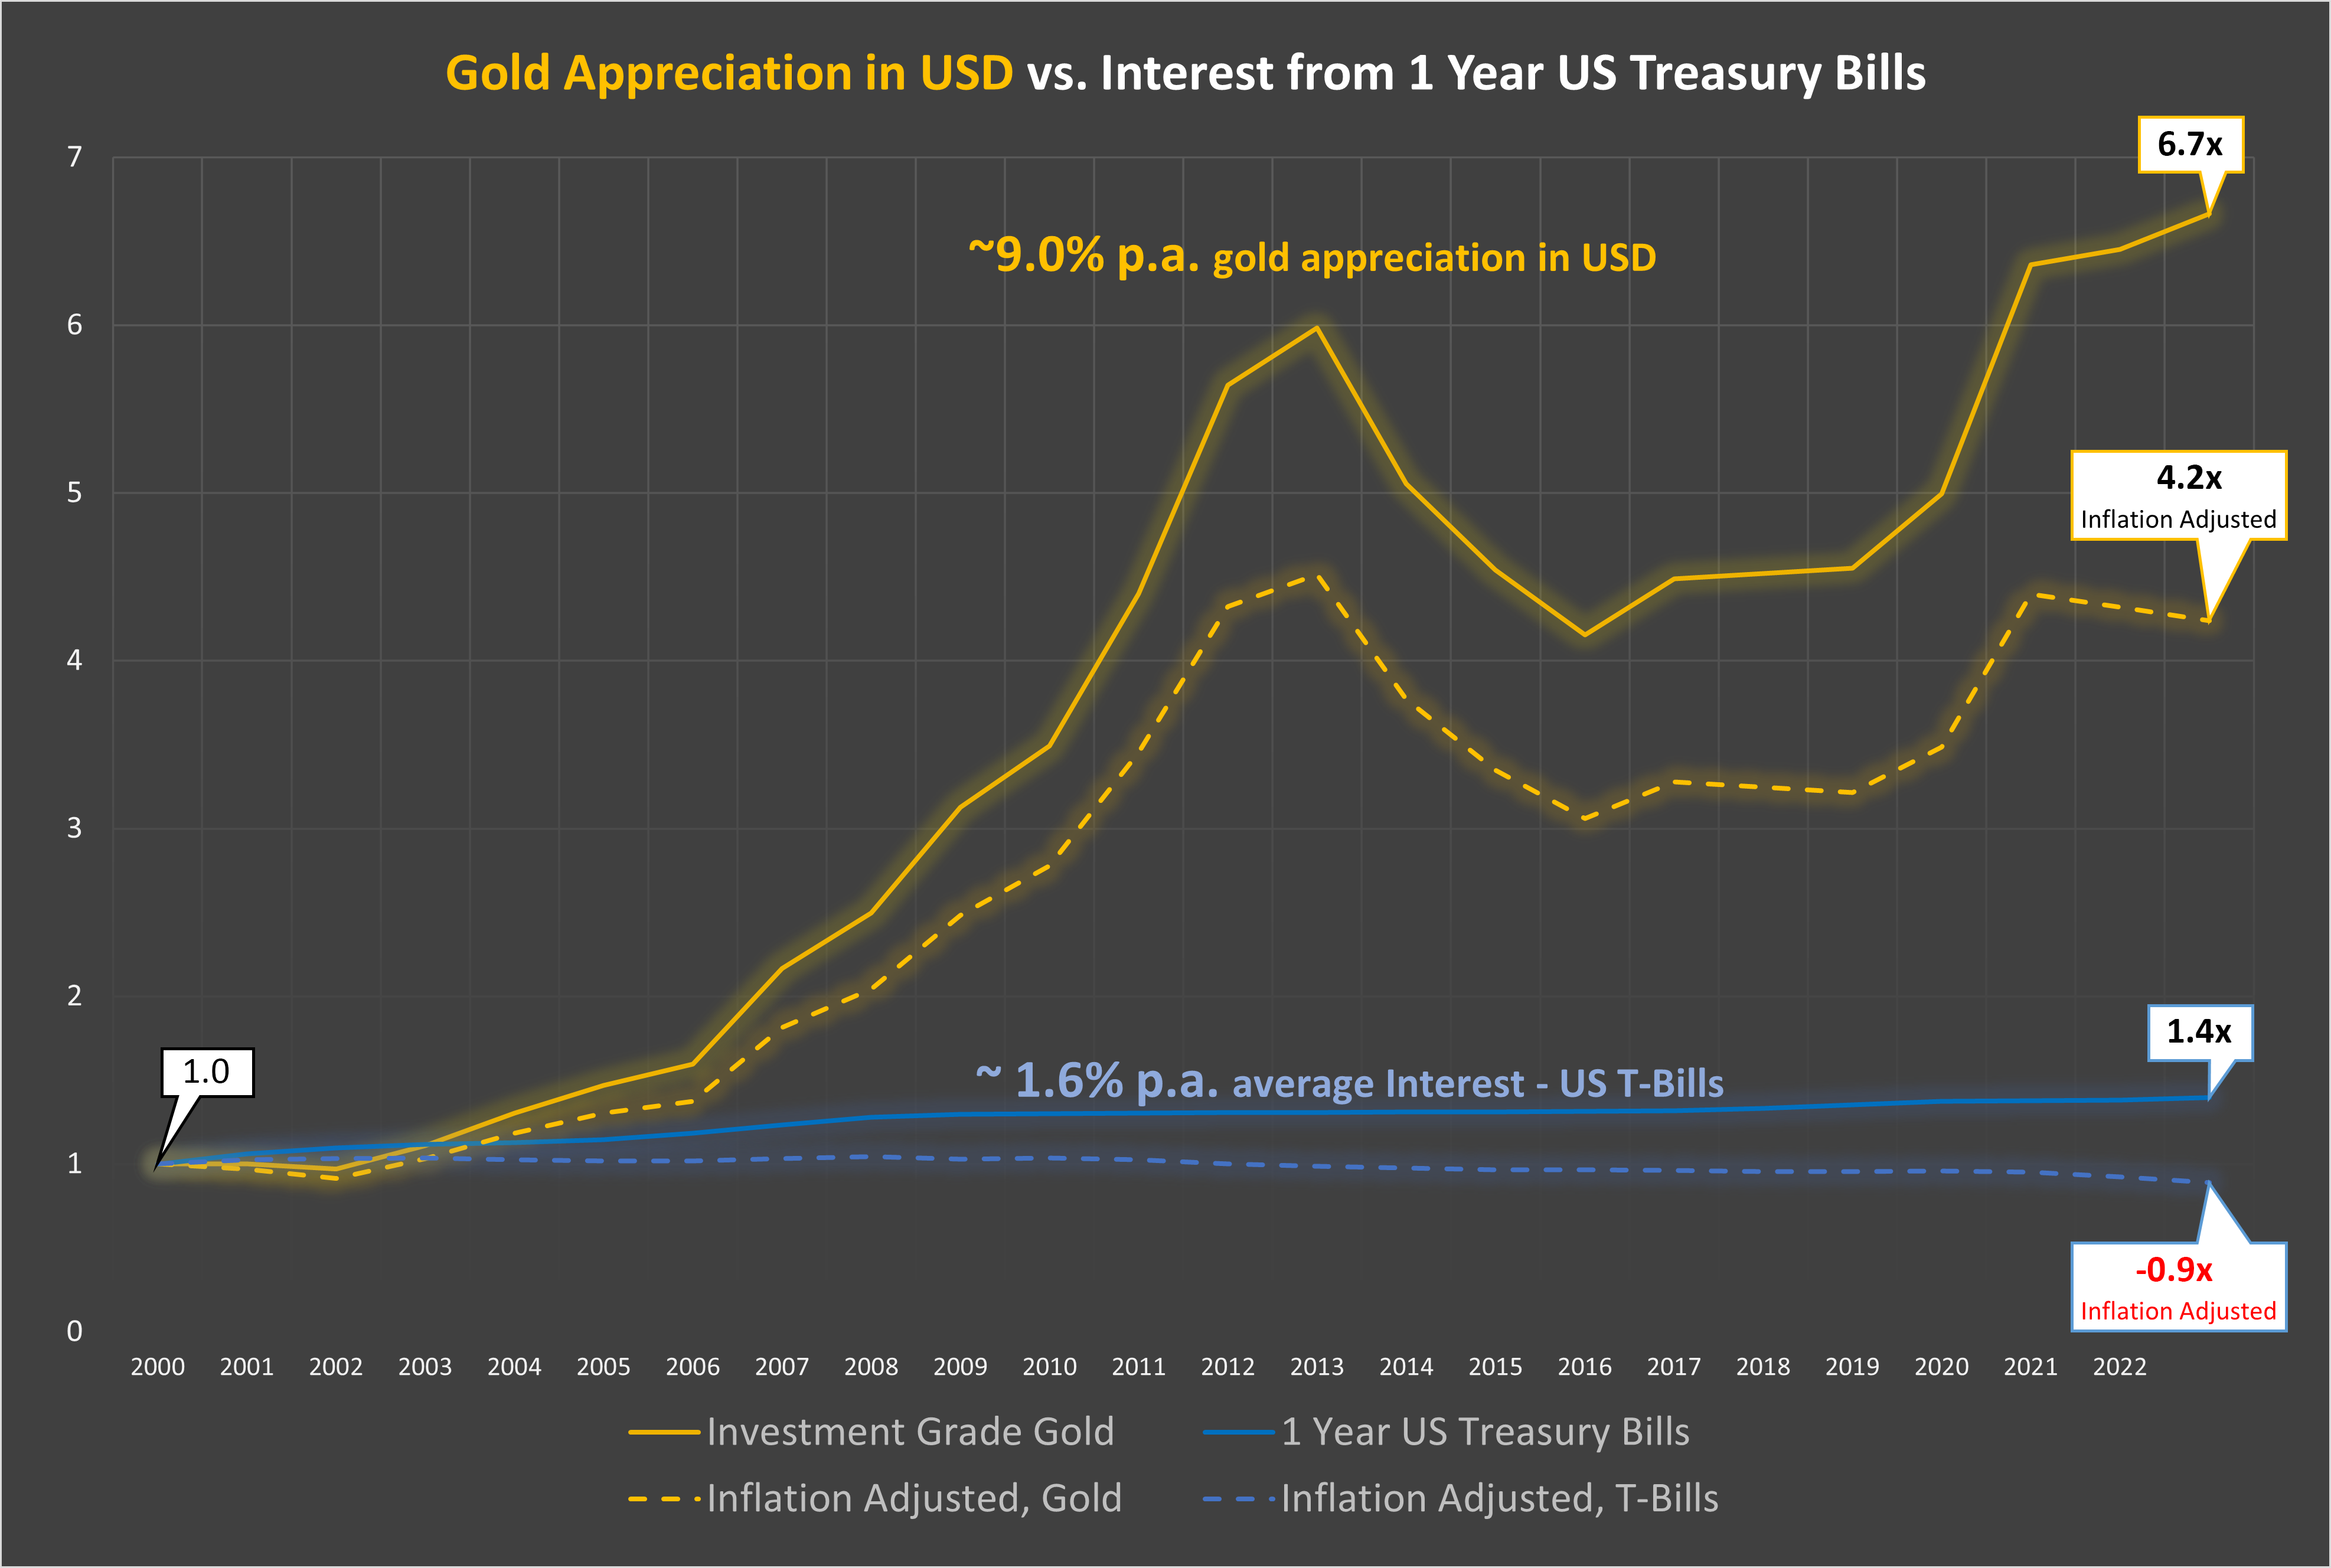
US 1 year Treasury Bills would have yielded 40 cents of interest for every dollar invested between 2000 and 2022, paying an average 1.6% in interest. T-Bill would not have made up for inflation losses which averaged around 2.2% causing prices of goods to rise by about 57% since 2000.
Investing in US 1 year Treasury Bills would therefore have caused a real purchasing power loss of 11% (1.40/ 1.57 = ~0.89) despite earning 40% in interest over 22 years.
Investment Grade Gold, as measured in US dollars, had an average yearly return of ~9% since 2000, easily beating the ~1.6% yearly inflation during this period and resulting in strong purchasing power gains.
Each dollar invested in gold in 2000 would have been worth around 6.66 USD in mid-2022, easily beating inflation and providing a 4.2 times real purchasing power increase (6.66/1.57 = 4.24).
Gold rises and falls in the short term, but gold reliably appreciates over time whereas inflation incessantly erodes the value of dollars and interest earned often does not compensate for the loss.
Chart Source Data (click here)
Gold Price: Uses the average yearly gold closing price as reported by Macrotrends.
See https://www.macrotrends.net/1333/historical-gold-prices-100-year-chart
1 Year Treasury Rate: Uses the yearly “Average Closing Price” rate as reported by macrotrend from data published by the Federal Reserve Board.
See https://www.macrotrends.net/2492/1-year-treasury-rate-yield-chart
Singapore Dollar to US Dollar FX Rate: Uses the yearly “US Dollar” rate as reported by the Monetary Authority of Singapore (MAS).
See https://eservices.mas.gov.sg/Statistics/msb/ExchangeRates.aspx
US Inflation Rate: as reported by the Federal Reserve Bank of St. Louis.
See https://fred.stlouisfed.org/series/FPCPITOTLZGUSA
GOLD vs. GERMAN 10 YEAR BONDS
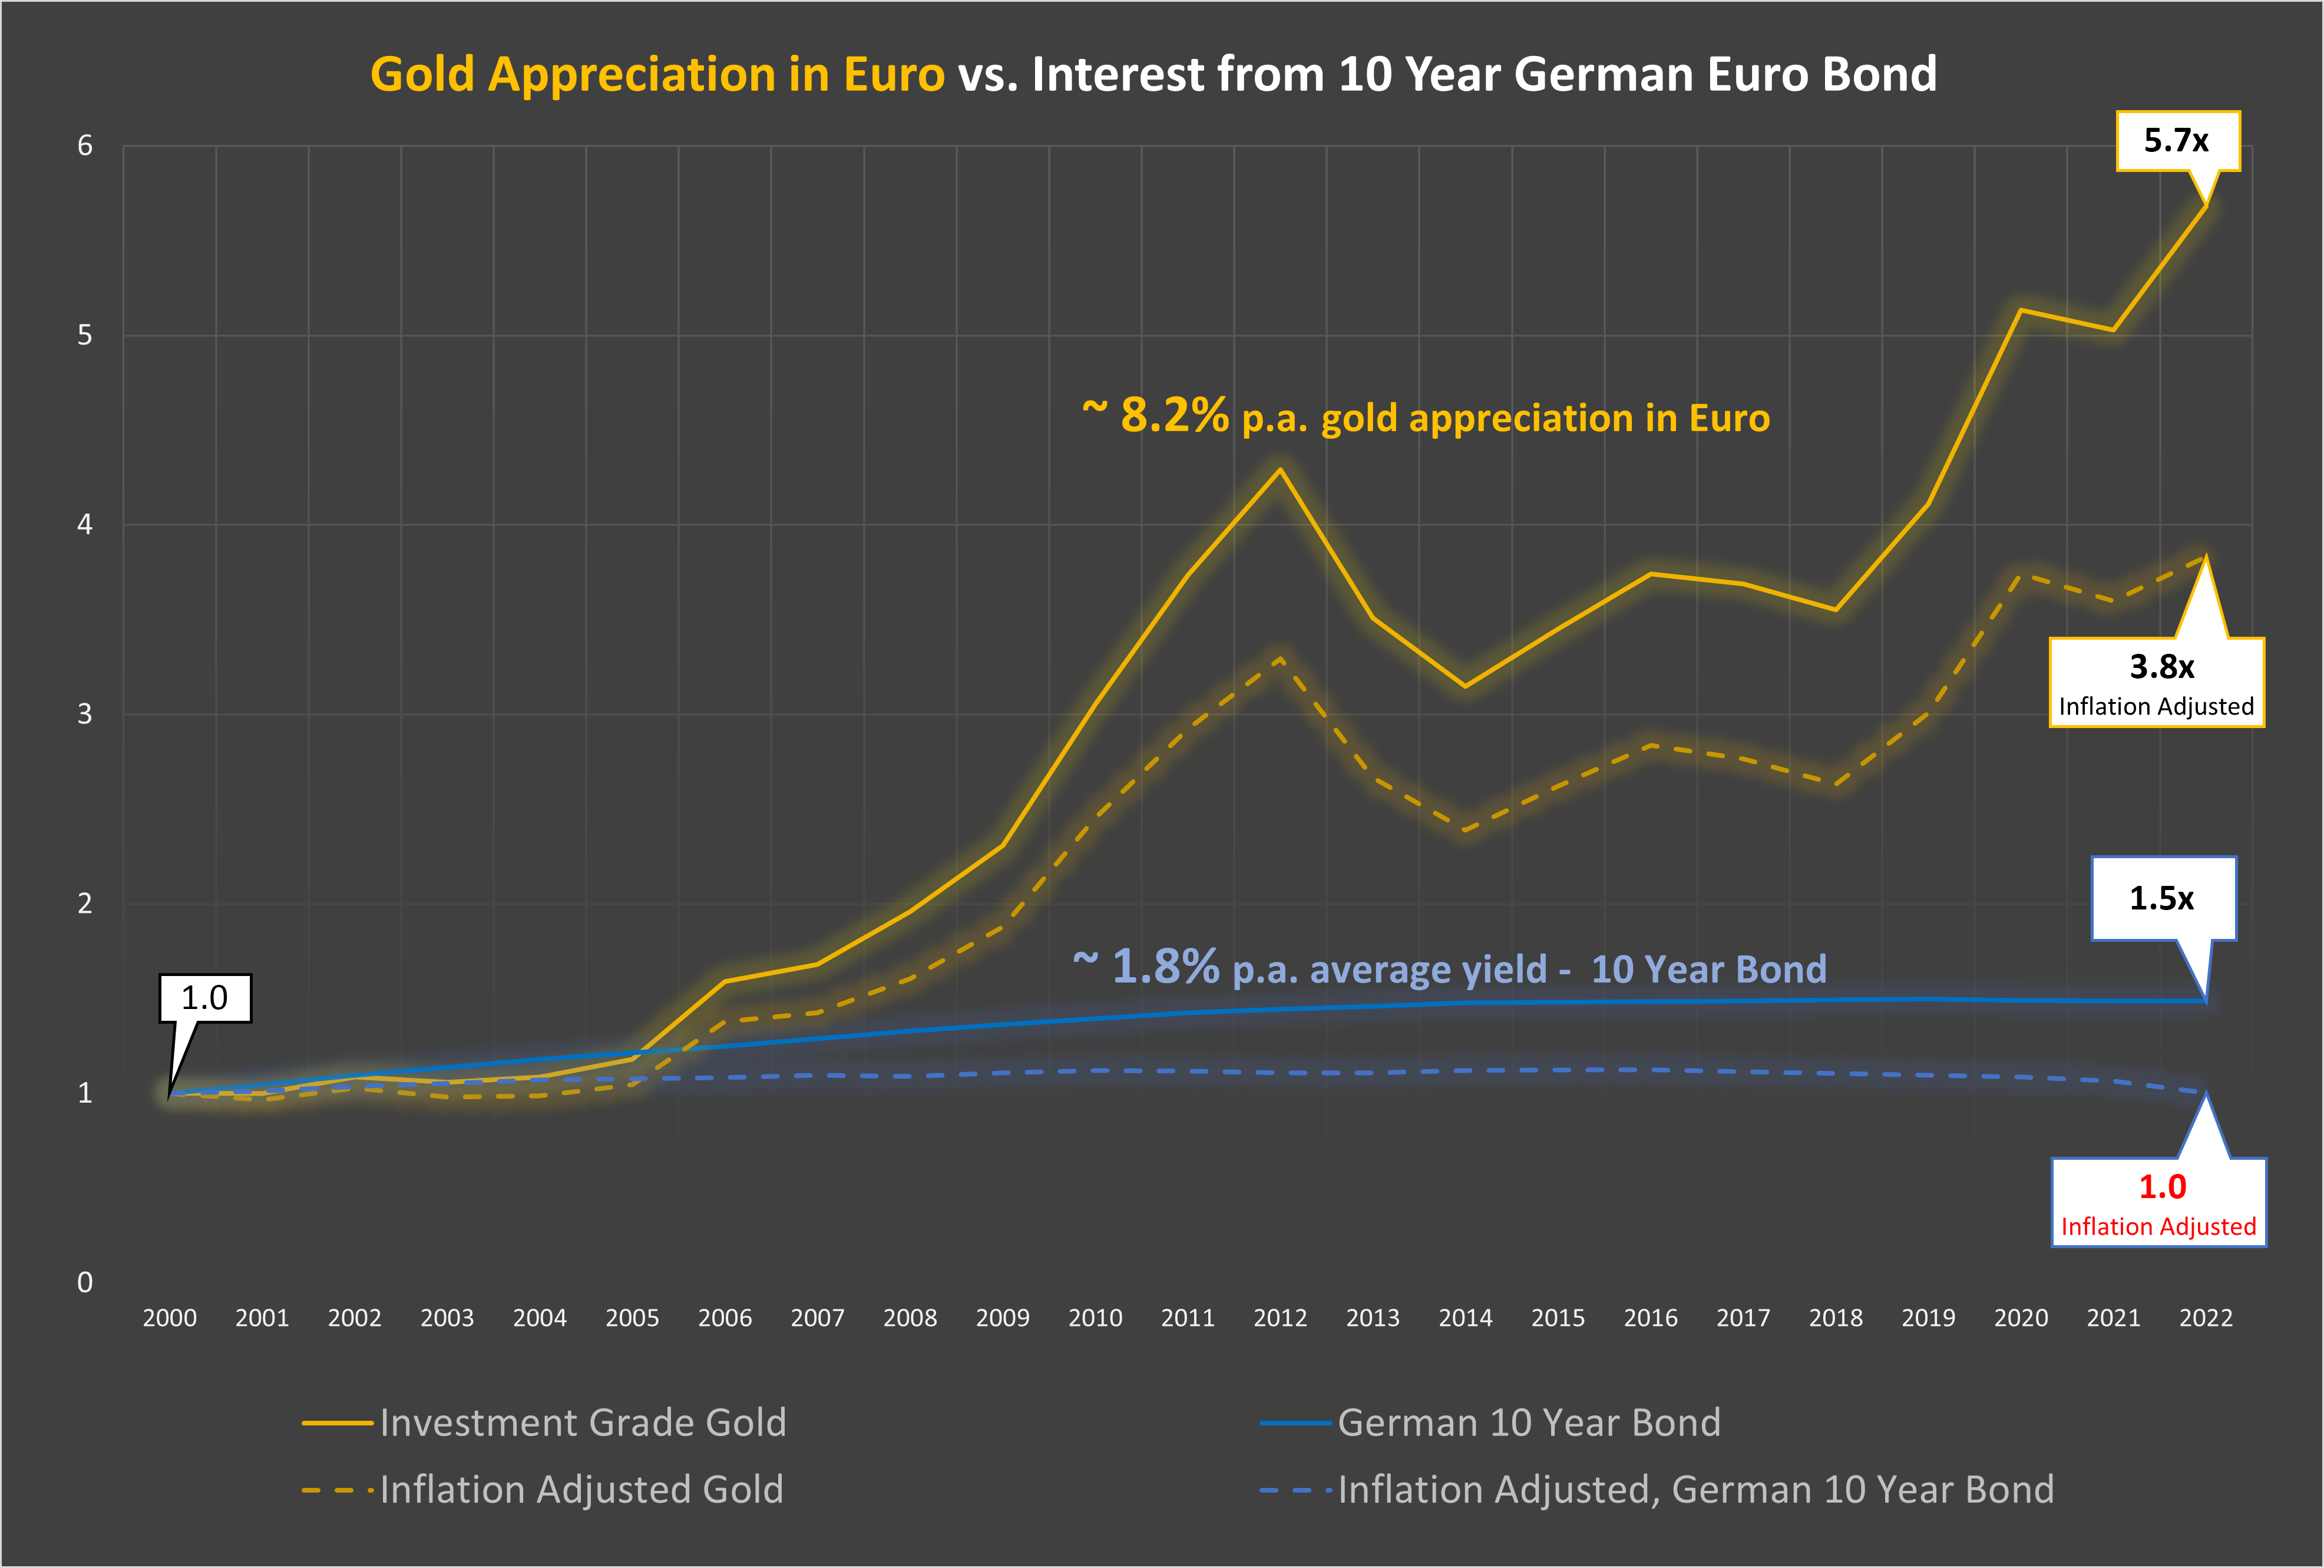
GERMAN 10 YEAR BONDS would have yielded 49 cents of interest for every euro invested between 2000 and 2022, paying an average 1.8% in interest. Average yearly inflation in Europe over the same period was also around 1.8% per year pushing prices up a nearly identical 48%.
Investing in 10-year German bonds would therefore have caused no material change in your purchasing power.
Investment Grade Gold, as measured in Euro, however had an average yearly return of ~8.2% since 2000, easily beating the ~1.8% yearly inflation during this period and resulting in strong purchasing power gains.
Each Euro invested in gold in 2000 would have been worth around 5.68 Euro in mid-2022, easily beating inflation and providing a 3.8 times real purchasing power increase (5.68/1.49 = 3.83).
Gold rises and falls in the short term, but gold reliably appreciates over time whereas inflation incessantly erodes the value of dollars and interest earned often does not compensate for the loss.
Chart Source Data (click here)
Gold Price: Uses the average yearly gold closing price as reported by Macrotrends.
See https://www.macrotrends.net/1333/historical-gold-prices-100-year-chart
German 10 year Bond Yield: Uses the monthly average (January for each year) rate as reported by investing.com.
See https://www.investing.com/rates-bonds/germany-10-year-bond-yield-historical-data
Euro to US Dollar FX Rate:Uses the yearly “Euro” to “US Dollar” rates as reported by OFX.
See https://www.ofx.com/en-sg/forex-news/historical-exchange-rates/yearly-average-rates/
Euro Inflation Rate: Uses the yearly European Union inflation rate as reported by Macrotrends.
See https://www.macrotrends.net/countries/EUU/european-union/inflation-rate-cpi
Recommended Readings:
- The first two United Stated currencies failed, read "Not Worth a Continental"
- The Virtuous & Vicious Cycle
- Hyperinflation Happens When People Lose Trust
- Where is the New Volcker, and Why Should We Care?
